And the (Predicted) Winner is...
Forecasting who will win the 2022 WNBA MVP using machine learning
Thanks for reading the Her Hoop Stats Newsletter. If you like our work, be sure to check out our stats site, our podcast, and our social media accounts on Twitter, YouTube, Facebook, and Instagram. You can also buy Her Hoop Stats gear, such as laptop stickers, mugs, and shirts!
Haven’t subscribed to the Her Hoop Stats Newsletter yet?
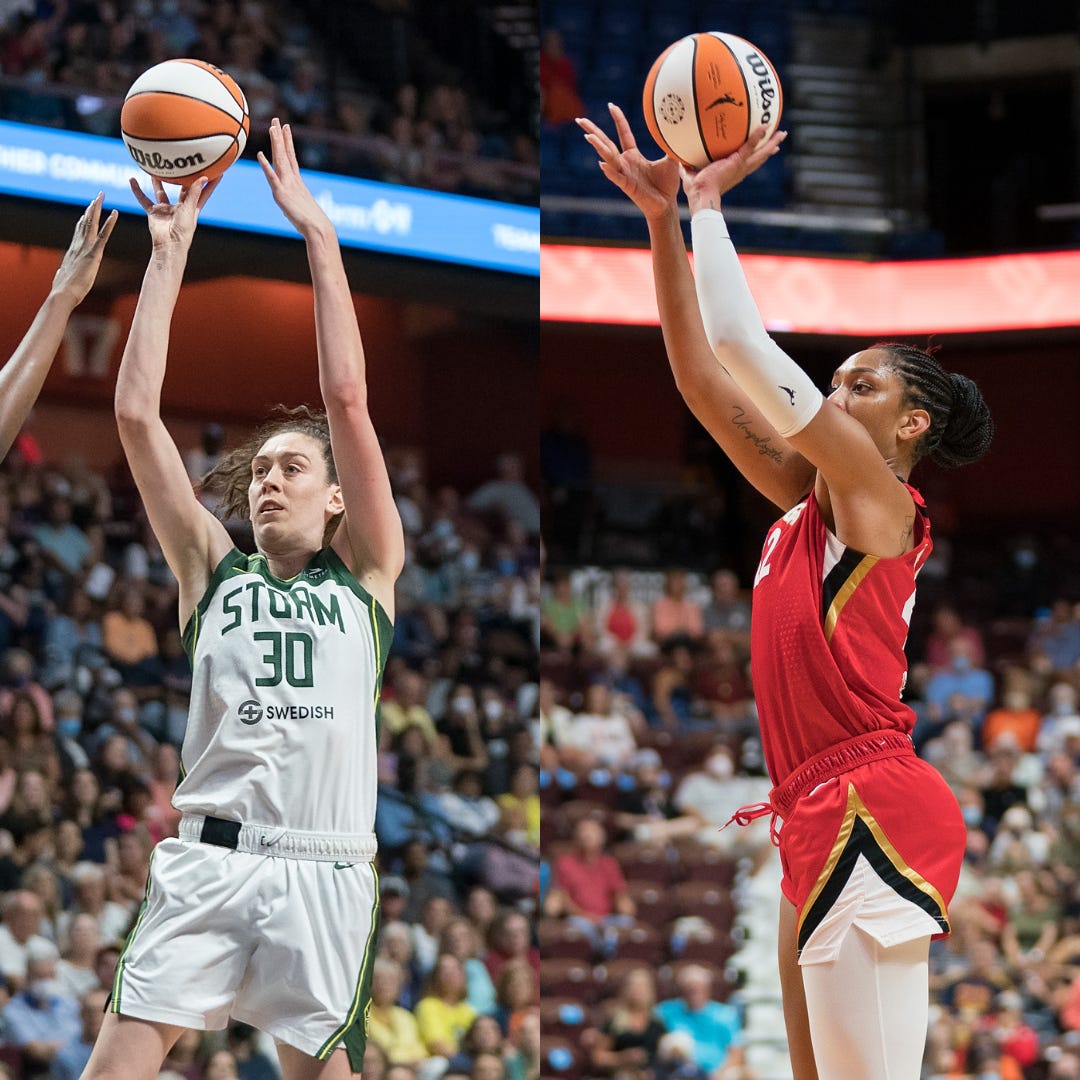
Who will win WNBA MVP this season? It’s a difficult question not only because the margin between the 2022 campaigns of A’ja Wilson and Breanna Stewart is razor thin, but also because there aren’t explicit criteria guiding voters in their selection. After all, what exactly does Most Valuable Player mean? Is it the best player on the best team, the player who puts up the most impressive numbers, or some ill-defined hybrid of the two? There’s a multitude of opinions about what should be the proper definition, but today, we at Her Hoop Stats have used machine learning to predict what voters will do based on the MVP races of the past. As a result, we can estimate a player’s odds of winning the league’s top regular-season prize. To be clear, this is a model of how the voters will vote, not who added the most value from a statistical perspective.
The prototypical MVP
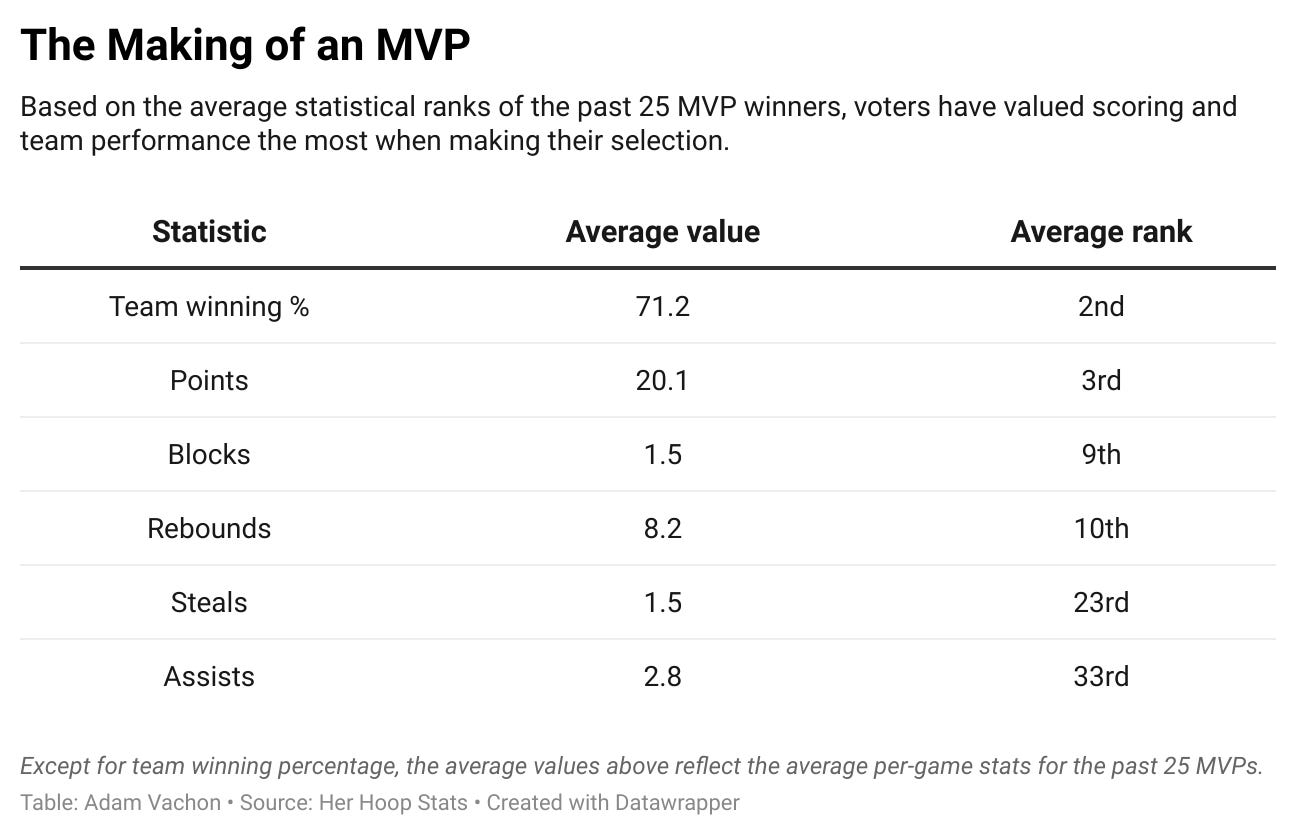
To understand which factors most influence who wins MVP, it’s instructive to construct a profile of the typical winner. With the average MVP winner ranking third in points and playing on the league’s second-best team, it’s clear that voters have placed the highest premiums on scoring proficiency and team performance. Whether or not it’s their greater potential to impact both ends of the court, post players have generally been the preferred MVP choice over guards. Unfortunately for the likes of Courtney Vandersloot, Natasha Cloud, and Sue Bird, that’s reflected in the average MVP ranking just 33rd in the league in assists per game, compared to average rankings of ninth and 10th for blocks and rebounds, respectively.
Let’s first focus on points - it’s the most direct and measurable way a player can add value to their team. It follows that voters have assigned it a high level of importance. More than half of the winners ranked in the top two in points per game during their MVP campaigns and a whopping 92% (23 out of 25) were in the top five. Basically, unless you’re a serial stat stuffer like Tamika Catchings in 2011 or Candace Parker in 2013 (who during those MVP campaigns finished 11th and sixth in scoring, respectively), you can kiss your MVP chances goodbye if you’re not among the league’s top five scorers.
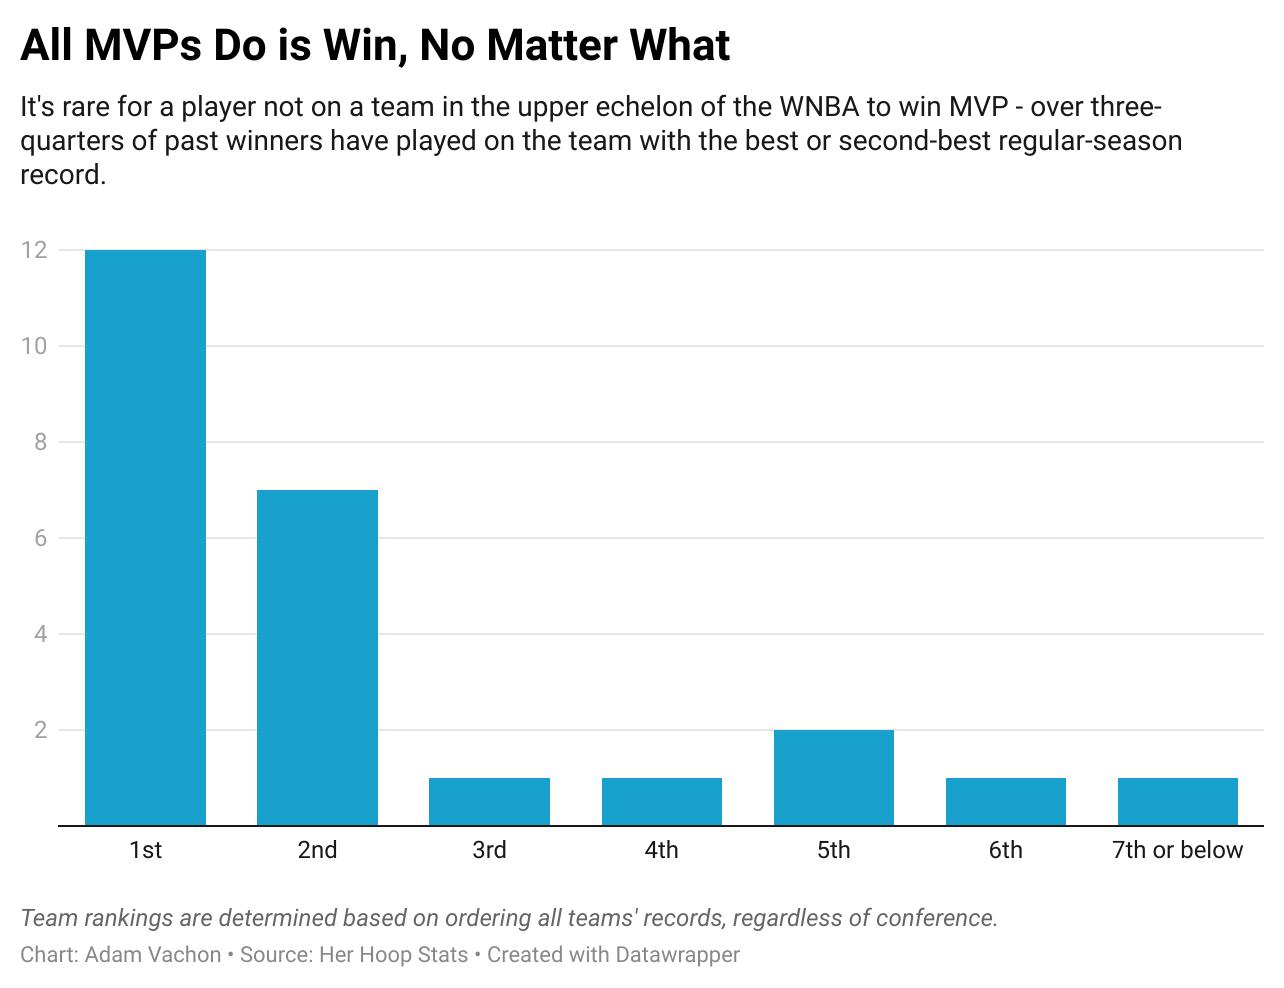
In what is certainly music to the ears of the “best player on the best team” crowd, team performance has played an even more prominent role in determining each season’s Most Valuable Player. Valid arguments against this approach exist (e.g., in the vein of it being an individual honor and not a team award), but it does have some intuitive appeal. Players add value by helping their team win, so how much value can a player on a poorly performing team really be adding? However, MVP voters have taken this concept to the extreme in past years - 19 of the league’s 25 MVP recipients, or 76%, have come from one of that season’s top two teams. Even if one extends the scope to include the top five vote-getters each season, 68% of them since 2009 played on teams that finished in the top three of the regular-season standings.
Building the model
Insights like the aforementioned drive the machine learning model we built to systematically predict a player’s chances of winning MVP. The first step in the process was to brainstorm what we thought were the most likely statistics to influence voters. We expected scoring and team success to play a role, with multiple options for how to measure team success. We also figured that other traditional box score stats (rebounding, assists, steals, and blocks) would contribute. While “analytics” stats including win shares and player efficiency rating (PER) are becoming more common in women’s basketball, they have not been prominent over the history of the league, so we have not included them for this initial work. Situations like Elene Delle Donne this year also highlighted the need to consider availability. Finally, we tracked not just the actual value of metrics (e.g. Tina Charles scored 23.4 points per game in 2021) but also their rank in the league that season (e.g. Charles was No. 1 in the league in points per game in 2021).
Armed with our data (the stats, the ranks, and who won MVP each year), which is always the bulk of the work in predictive modeling, we were ready to do the analysis. We won’t go into the gory details of how we built the model, but for those with a data science background, we did our cross-validation with a “leave one year out” approach and evaluated model performance based on log loss. We tried a few different modeling techniques and found that logistic regression with an L1 penalty performed the best. Not surprisingly, we have plenty of ideas for future work to improve the model.
What variables made the cut into our final predictions? Points per game, team rank in winning percentage, rebounds per game, percent of games played, steals per game, blocks per game, and assists per game, in order of importance. For all but team winning percentage, it was the value of the stat that conveyed meaningful information rather than the rank. None of those factors are particularly surprising, but one benefit of building a model is that we can weigh performances consistently.
2022 MVP Predictions
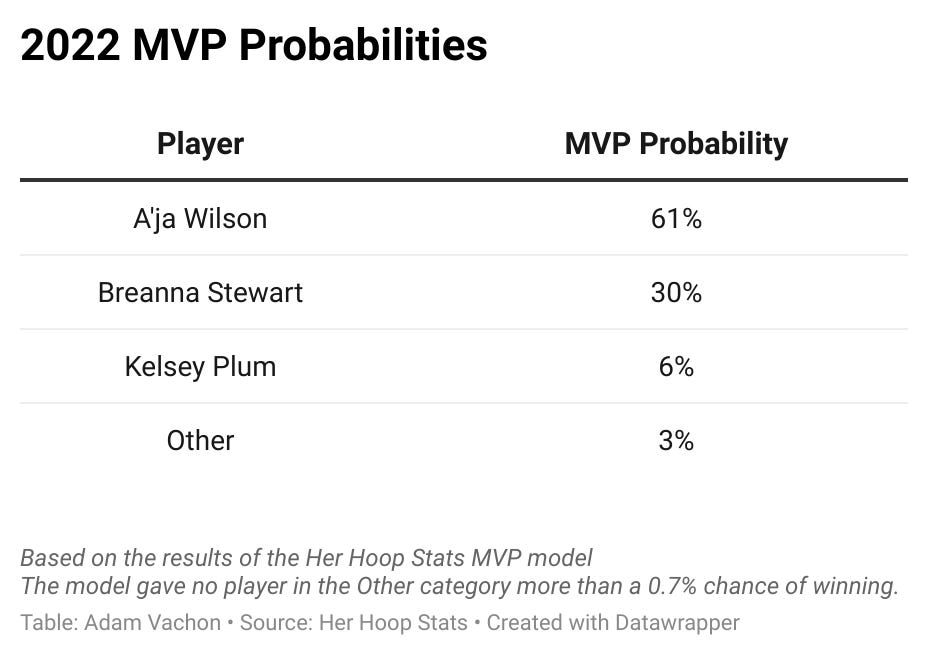
With the model in hand and the season complete, we can now apply it to this year’s MVP race. As expected, it’s essentially a two-person race between Wilson and Stewart. The model gives an edge to Wilson, as she has a 61% probability of winning compared to Stewart’s 30% given past voter behavior. Kelsey Plum rounds out the top three at 6%; no other player cracks even 0.7%.
A simple way to understand the edge our model gives to Wilson is that she leads Stewart in more of the factors that enhanced prediction accuracy. Another straightforward approach is to recall voters’ patterns relating to points per game rank and team rank. Wilson checks both of those boxes, ranking No. 5 in scoring this season and her team finishing first during the regular season. Stewart, on the other hand, led the league in scoring, but her team finished outside the all-important top two. The graph below indicates that Wilson’s numbers along these two metrics are slightly more in line with past MVP winners than Stewart's. This is not to say that Stewart won’t win MVP - our model still gives her a probability that’s better than the likelihood of her hitting two consecutive shots in the paint this season.
The case for each MVP candidate
In what is certain to set social media on fire, the league is scheduled to announce this season’s Most Valuable Player next Wednesday, September 7. It’s poised to be one of the closest votes in recent memory, as both Wilson and Stewart have compiled such strong cases for their candidacy.
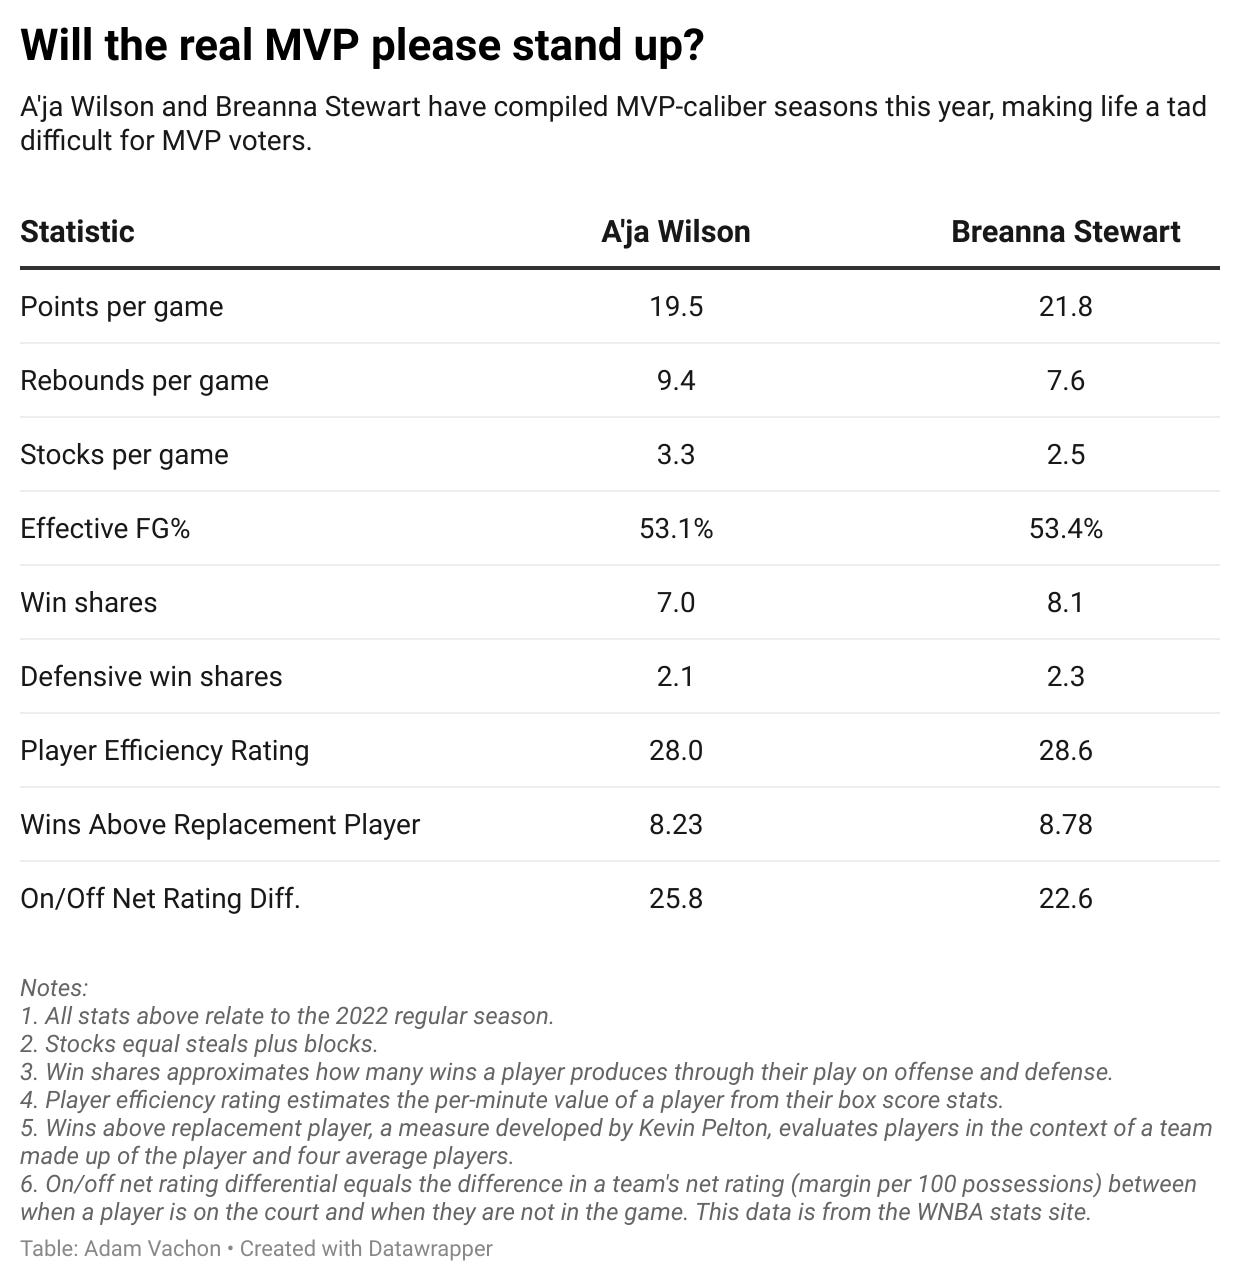
Wilson is the best player on the best team. Her versatility on defense - whether it be her elite rim protection (league-leading 1.9 blocks per contest) or her ability to guard the perimeter - propelled a lackluster Aces defense to the middle of the pack and earned her Defensive Player of the Year honors. She was also the only player this season to rank in the top five in points, rebounds, and blocks - no player even ranked in the top 10 in all three categories. Further evidence of Wilson’s value is her on/off net rating differential - the Aces outscored their opponents by 14.0 points per 100 possessions when Wilson was on the court and got outscored by 11.8 points per 100 possessions when she was on the bench. That +25.8 difference is the highest in the league (minimum 50 minutes played). All of this evidence is why over 70% of fans chose Wilson as their MVP in a recent (admittedly unscientific) Her Hoop Stats Twitter poll.
The Seattle Storm finished the regular season in fourth place, a team ranking that typically hasn’t boded well for MVP candidates. However, taking the award’s name at face value, arguably no one this season was more valuable to their team than Breanna Stewart. The winner of the AP Player of the Year accolade - Stewart received six votes; Wilson earned four - and Her Hoop Stats’ own Richard Cohen’s pick for the top prize, Stewart led the W in nearly every advanced statistic associated with player value, including win shares, win shares per 40 minutes, offensive win shares, player efficiency rating, and Kevin Pelton’s wins above replacement player metric.
Fans of the player who finishes second in this year’s voting will no doubt claim that their player was snubbed. That’s understandable, to a degree. Whether it’s Wilson or Stewart, whoever doesn’t win has a legitimate claim to one of (if not the) best non-MVP seasons in league history. As suggested by the table below, it all reinforces the idea of this being an incredibly tight race.
What’s next?
As far as this project is concerned, it’s an ongoing effort. We at Her Hoop Stats plan to fine-tune this model in the offseason, investigating such topics as whether there have been material changes in MVP voter behavior in recent years and if there are other factors worthy of inclusion in the model. The ultimate goal for next season is to release a daily tracker of a player’s MVP chances - stay tuned for that! In the meantime, if you have any questions, thoughts, or ideas relating to our model, please let us know in the comments below or by contacting us on Twitter @herhoopstats.
Thanks for reading the Her Hoop Stats Newsletter. If you like our work, be sure to check out our stats site, our podcast, and our social media accounts on Twitter, YouTube, Facebook, and Instagram.




I love this break down... would love to see something similar for DPOY - I'm always mystified at what factors drive the award.