Down goes №1! Are upsets really becoming more likely?
Parity — it’s one of those words that broadcasters and fans love to throw around every time a highly-ranked team loses to a lower-ranked team. And this season, a lot of highly-ranked teams have lost to lower-ranked teams. But are we really seeing more parity this year, or have a few high-profile upsets skewed the way we view the national landscape?
Spoiler alert: your eyes are not deceiving you. Any way you slice the data, the parity this season is real. We took a look at a few different indicators of competitive balance to put this season’s parity into perspective.
AP POLL
One way we can measure parity is simply by taking a look at the AP poll. After all, the conversation heats up the most when a №1 or №2 team loses. This year we have already seen four losses by top-two teams, including two at the hands of teams that weren’t even getting a single AP vote at the time. The madness started when №1 Oregon and №2 Baylor lost on the same day in November, and then new №2 Louisville fell to unranked Ohio State five days later. Most recently, №1 Stanford was taken down by unranked Texas on Dec. 22.
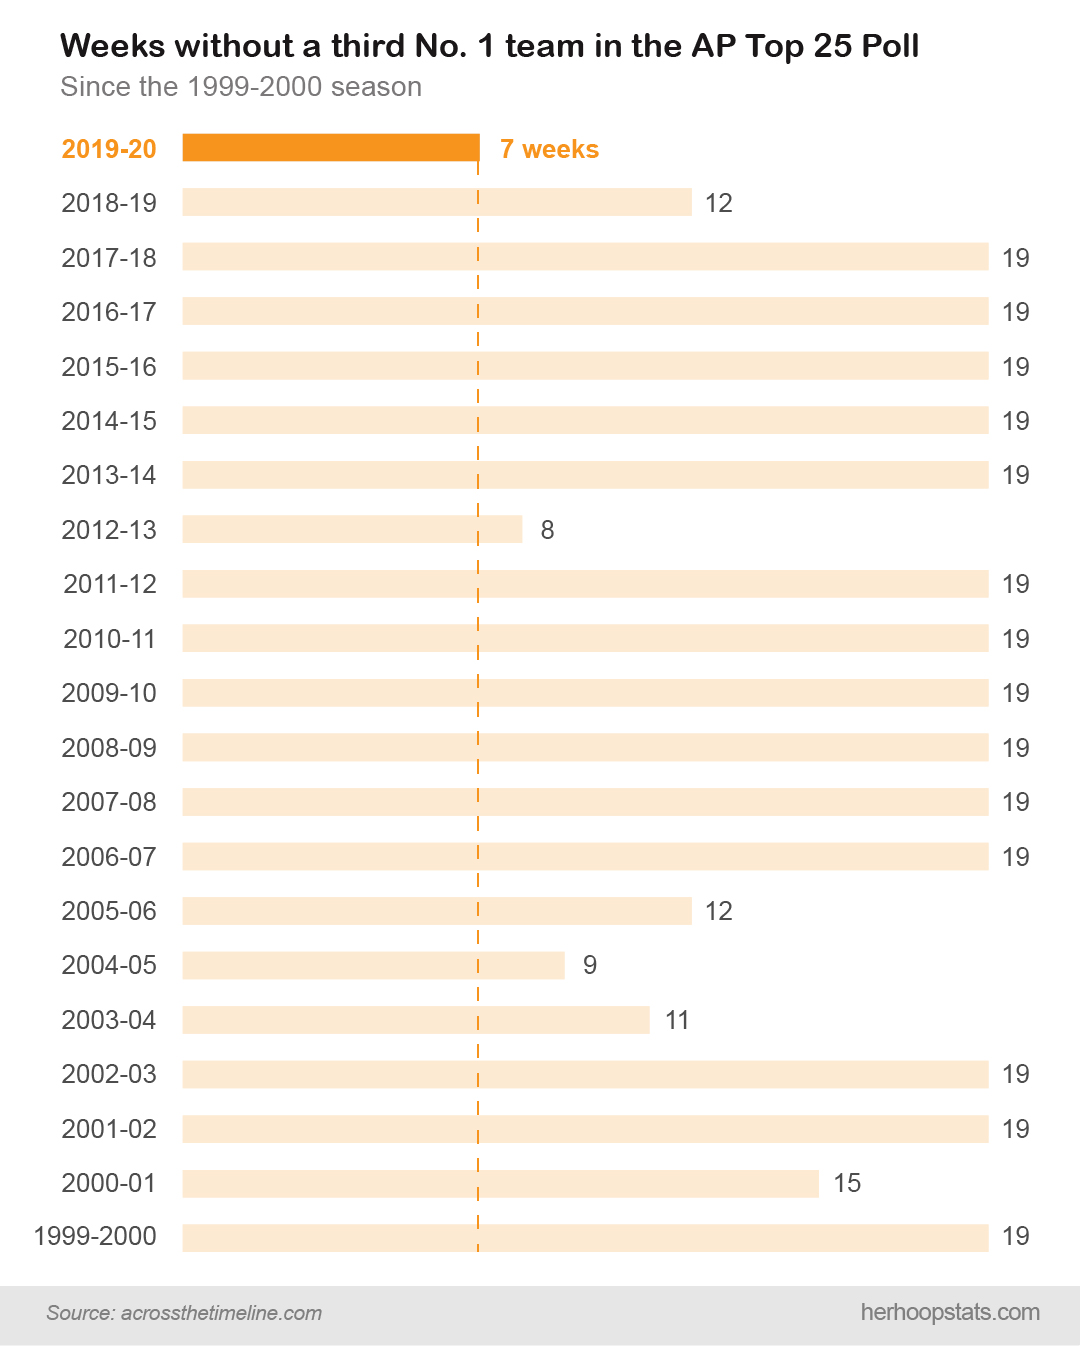
Stanford’s loss opened the door for UConn to become the third №1 this season, the first time that has happened before Christmas in over two decades. Here are the number of AP polls to start the year without a third №1 team over each of the last 20 seasons:

The historic movement in the AP poll isn’t just showing up in the top spot, though. The №2 spot was occupied by more teams before Christmas this season (four) than in any season since 2004–05, which was also the last season with two pre-Christmas upsets of №2.
NOLL-SCULLY METRIC
The next method we can use is a metric developed by Roger Noll and Gerald Scully. David Berri does a good job of explaining the math behind the Noll-Scully metric over at Wages of Wins, but the general idea is based on standard deviation — a measure of how spread out a group of numbers is.
The average winning percentage in all of Division I is always .500, so the closer to .500 that the average Division I team is, the more competitive balance there is. The less the average team’s winning percentage deviates from .500, the lower the standard deviation and the higher the parity. But that doesn’t quite tell the whole story.
Teams’ winning percentages tend to get closer to .500 as the season goes on and the number of games increases. For example, think about how many teams have won 0% or 100% of their games after one week. It’s a lot more than the number of winless or undefeated teams now, which itself is more than the number of such teams in February. Since the standard deviation of winning percentages will always be higher in December than at the end of the year, we need to adjust for the number of games played in order to compare this year’s partial season to past full seasons.
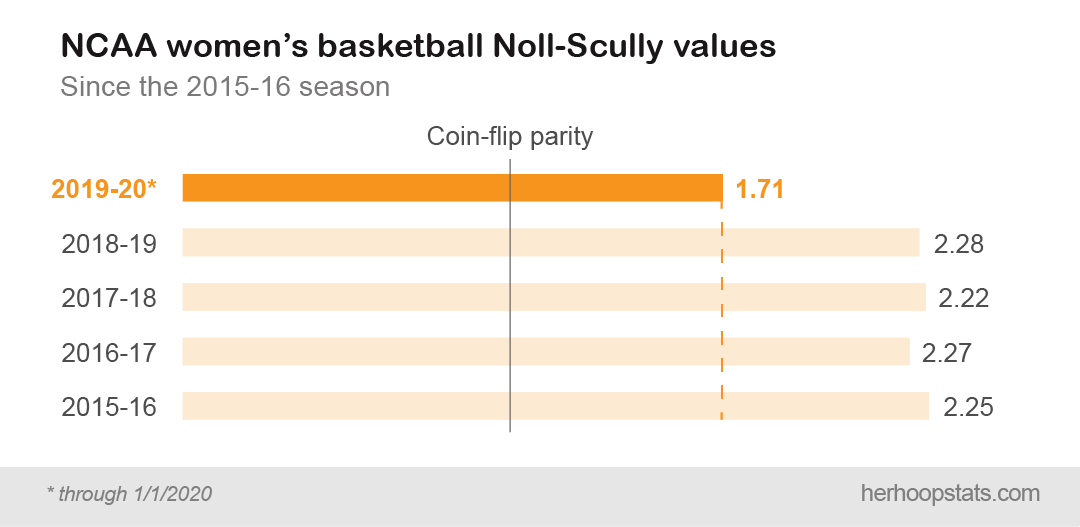
That’s what the Noll-Scully metric does. It adjusts for the number of games played by using something called the idealized standard deviation, which is what the standard deviation would be expected to be after a certain number of games if all teams were truly equal. We can use it as a “baseline” of sorts. The metric, then, is just the actual standard deviation divided by the idealized standard deviation. If those two numbers are the same, the Noll-Scully value will equal one, signifying the same level of competitive balance as a league in which every single team is equally matched. Let’s call that level of competitive balance “coin-flip parity” — the level of parity that we’d expect if every game were determined by a simple coin flip.
Looking at the Noll-Scully values for the last five seasons, this season’s value is much closer to coin-flip parity:

HER HOOP STATS RATING
The Noll-Scully metric is terrific for measuring mathematical parity across all 351 teams, but casual fans generally don’t care if No. 351 is more or less likely to beat No. 251. The upsets of top-ranked teams are where the perceived parity comes from.
Our Her Hoop Stats rating measures expected margin per 100 possessions over an average team on a neutral court. For example, a team with an HHS rating of 30 would be expected to outscore an average team on a neutral court by 30 points for every 100 possessions. This can be used to estimate win probabilities — the closer together two teams' HHS ratings are, the more likely the upset.
How do these ratings help us understand parity? Consider that dominant 2015–16 UConn team. The Huskies that season faced top-20 competition a whopping 13 times, yet still won every game by double digits! Their HHS rating was 66.8. The HHS rating of Syracuse, the tenth-best team in our rating and UConn’s title-game victim, was 32.7. The difference between those two ratings was 34.1, meaning that the best team was expected to outscore the tenth-best team by 34 points per 100 possessions.
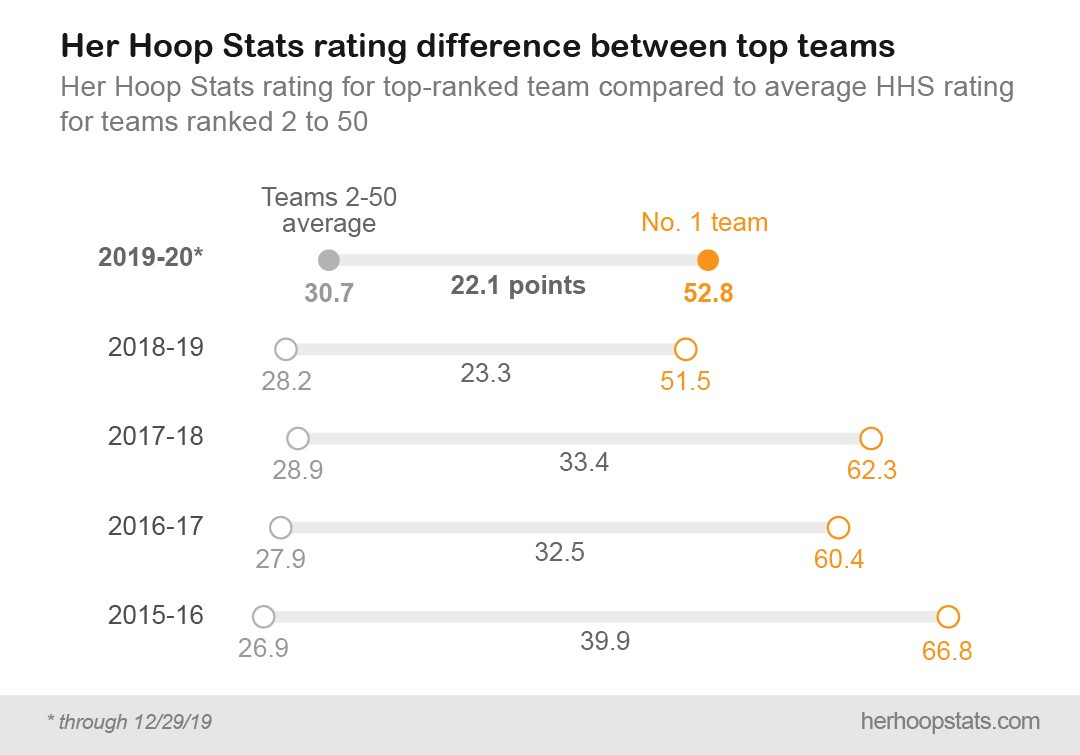
The gap between the best team and other tournament-level teams has been narrowing — the current best team (Baylor) would be expected to outscore the tenth-best team (Mississippi State) by only 12 points per 100 possessions. Let’s take a look at how close the average top-50 team in HHS rating has been to №1 over the last five seasons.

While the distance between other top 50 teams and №1 is shrinking, this season’s average is only slightly lower than last season’s. But when you take into account the fact that teams typically move closer to the average as the year progresses — and thus closer to each other — the fact that this year’s average is already below that of last season is a testament to the growing competitive balance at the top of Division I.
For fans of teams like UConn or Notre Dame, growing parity might not be a welcome sight. We are almost certainly not going to see another 100-game winning streak or a national championship between two unbeatens any time soon. For general fans of the sport, however, it is one of the most exciting times in recent memory. Ranked opponent or not, every time a №1 or №2 team takes the court, there’s a chance to see something special. So buckle up, college hoops fans — as conference play gets underway in earnest, we should be in for a wild ride!
If you like this content, please support our work at Her Hoop Stats by subscribing for just $20 a year. All stats and data were compiled from Her Hoop Stats and Across the Timeline and are updated as of games through December 31.


