Updated NCAA Win Shares Calculation
Breaking down the changes to our NCAA win shares calculation and how we have customized the formula's assumptions to the women's game
Thanks for reading the Her Hoop Stats Newsletter. If you like our work, be sure to check out our stats site, our podcast, and our social media accounts on Twitter, YouTube, Facebook, and Instagram. You can also buy Her Hoop Stats gear, such as laptop stickers, mugs, and shirts!
Haven’t subscribed to the Her Hoop Stats Newsletter yet?
Here at Her Hoop Stats, we’re always looking for ways to improve so we can achieve our goal of unlocking better insight for women’s basketball. To that end, we’re excited to announce that we recently changed two key assumptions in the formula for calculating NCAA win shares, a statistic that estimates the total number of wins a player produces for their team through their play on the offensive and defensive ends of the court. In other words, win shares divide up credit for a team’s wins. If you add up the win shares for each player on a team, theoretically, the sum should be equal (or at least reasonably close) to a team’s win total. As we’ll demonstrate below, our updated win shares formula more closely aligns team wins and win shares and applies to all seasons in our database (going back to 2009-10).
We believe this is the first time a group has customized these win shares assumptions to the women’s game. None of this would have been possible without folks like Dean Oliver and those at Sports Reference. In his groundbreaking book, “Basketball on Paper,” Oliver derived key components of the win shares formula, namely points produced, offensive possessions, and defensive rating. While the full win shares formula is rather complex, Sports Reference very clearly outlines the steps for calculating win shares on its website. The changes we’ve made specifically for the women’s game are an extension of their excellent work.
What is the impact on players’ win shares?
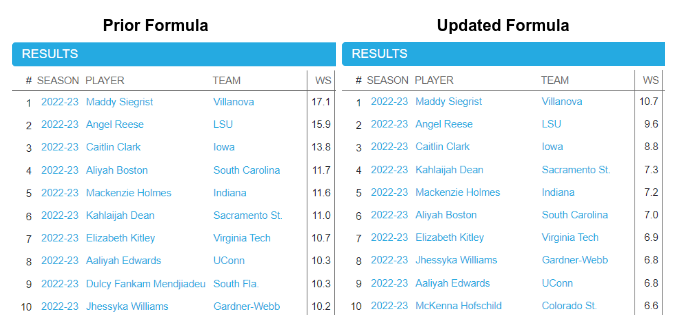
The technical details of the changes appear below, but in general, the updated formula reduces the number of win shares for each player. Our previous implementation of the win shares formula effectively produced too many win shares when compared to team wins. When it comes to player win shares rankings, we observed some changes that were mostly small. Take this season for example. Comparing our previous formula’s output of win shares for the nation’s top 10 (on the left) to that for the current formula (on the right), the values are scaled down. However, the order is mostly preserved, with the rank of six players unchanged, including the top three, and the other players in the top 10 moving by two spots.
What we changed
The formula for win shares is complicated, so instead of diving into every component of the formula, we’ll focus on the parts of the formula that we tailored to women’s college basketball. We encourage you to check out Sports Reference for further details on the standard win shares formula.
Marginal points per win
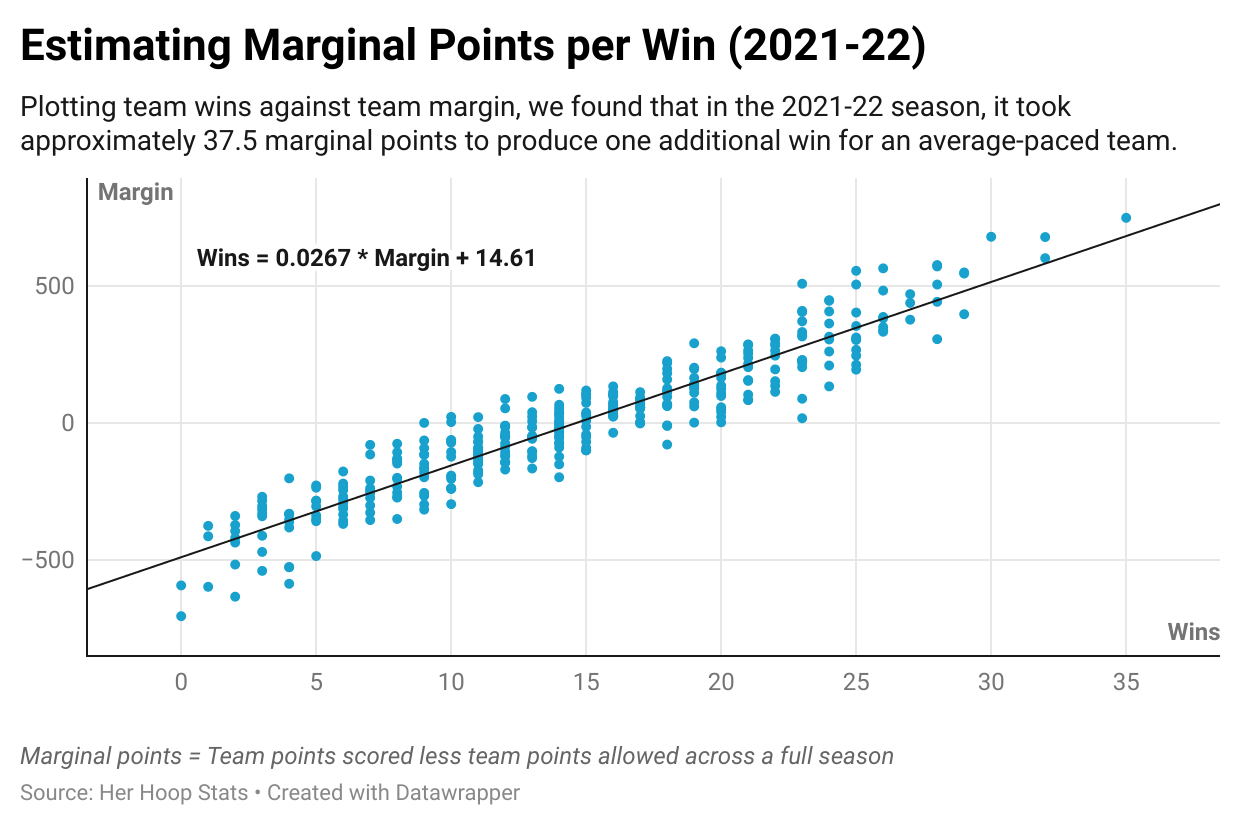
A key part of the win shares formula involves assumptions around how many extra points a team needs in a season for an additional win, a figure known as marginal points per win. To estimate this for NCAA women’s basketball, we plotted team wins against margin (team points scored less team points allowed across a full season) for each completed season since 2009-10 and calculated the line of best fit.
For example, below is the scatterplot we produced for the 2021-22 season. The line of best fit indicates that approximately 37.5 marginal points were needed to produce one additional win last season (i.e., 1.0 divided by the slope of the line of best fit, 0.0267).
Repeating this exercise for each season going back to 2009-10 demonstrated that the long-term average of marginal points per win is approximately 40. We noticed that recent seasons have deviated from this long-term average and, as such, considered varying our selected marginal points per win by season groupings. However, one of those seasons, 2020-21, was significantly impacted by COVID-19; teams played very few nonconference games. While we will monitor this to see if future seasons indicate similarly low marginal points per win, we have opted to rely on the long-term average of 40 for now.
Our selected marginal points per win of 40 is analogous to the part of the traditional marginal points per win formula that multiplies a constant by the average points per game for a Division I team. It’s also important to note that we have retained the portion of the traditional marginal points per win formula that adjusts for a team’s pace. That is, a team that plays at a faster pace requires more marginal points to create one additional win. Therefore, the 40 marginal points per win in our updated formula reflects the number of additional points an average-paced team needs to produce an additional win.
Marginal offense and defense
The other key components we adjusted were marginal offense and marginal defense. Generally speaking, these estimate the value a given player adds over and above a replacement player. Marginal offense is calculated as the estimated number of points a player produces less the estimated points produced by a hypothetical replacement player, which in the standard formula for college is thought to be 12.5% less productive than the league’s average player (or, in other words, a coefficient of 0.875 x [league points per possessions] x [offensive possessions]). A similar logic applies to marginal defense.
We tested several replacement player coefficients – marginal offense and defense replacement player coefficient pairs of 0.75/1.25, 0.775/1.225, 0.80/1.20, 0.825/1.175, 0.85/1.15, and 0.875/1.125 – and found that a marginal offense replacement player coefficient of 0.85 and a corresponding marginal defense replacement player coefficient of 1.15 yielded the smallest difference between team wins and win shares.
Win shares versus team wins
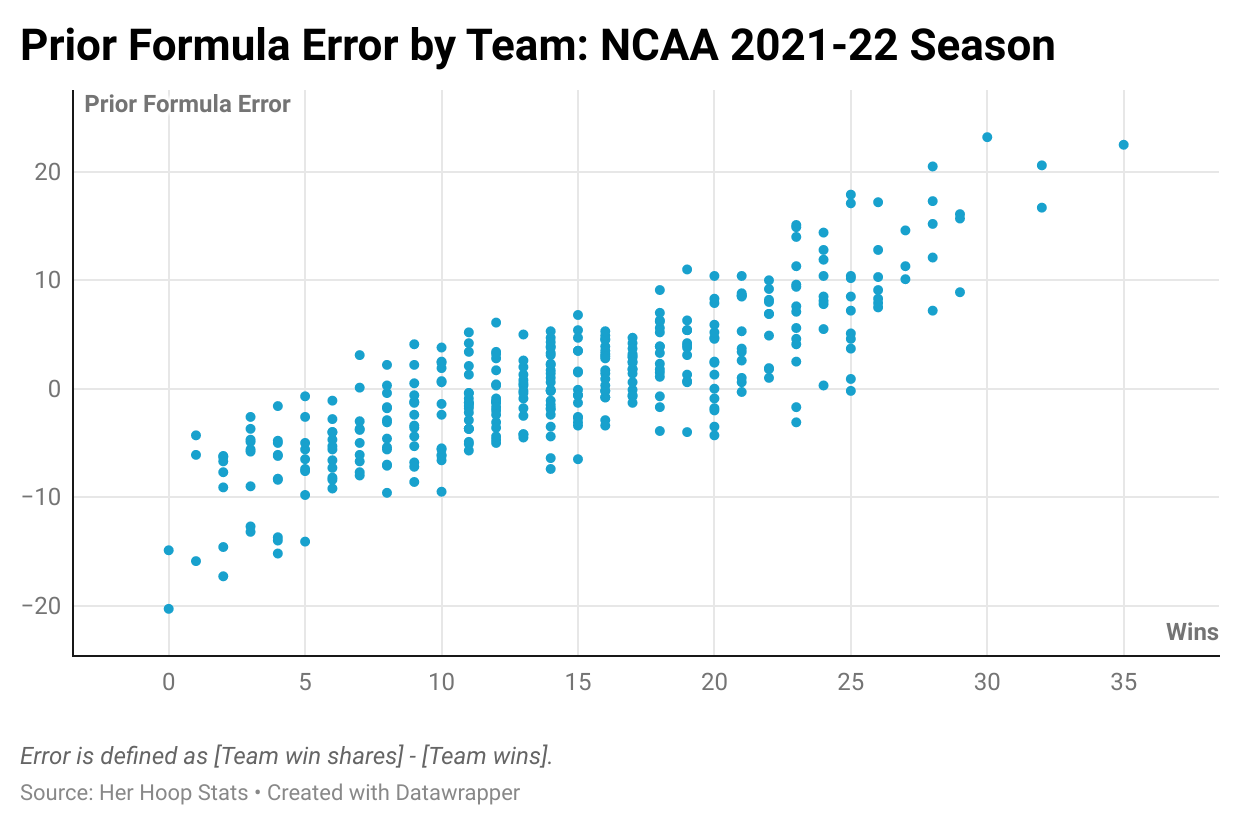
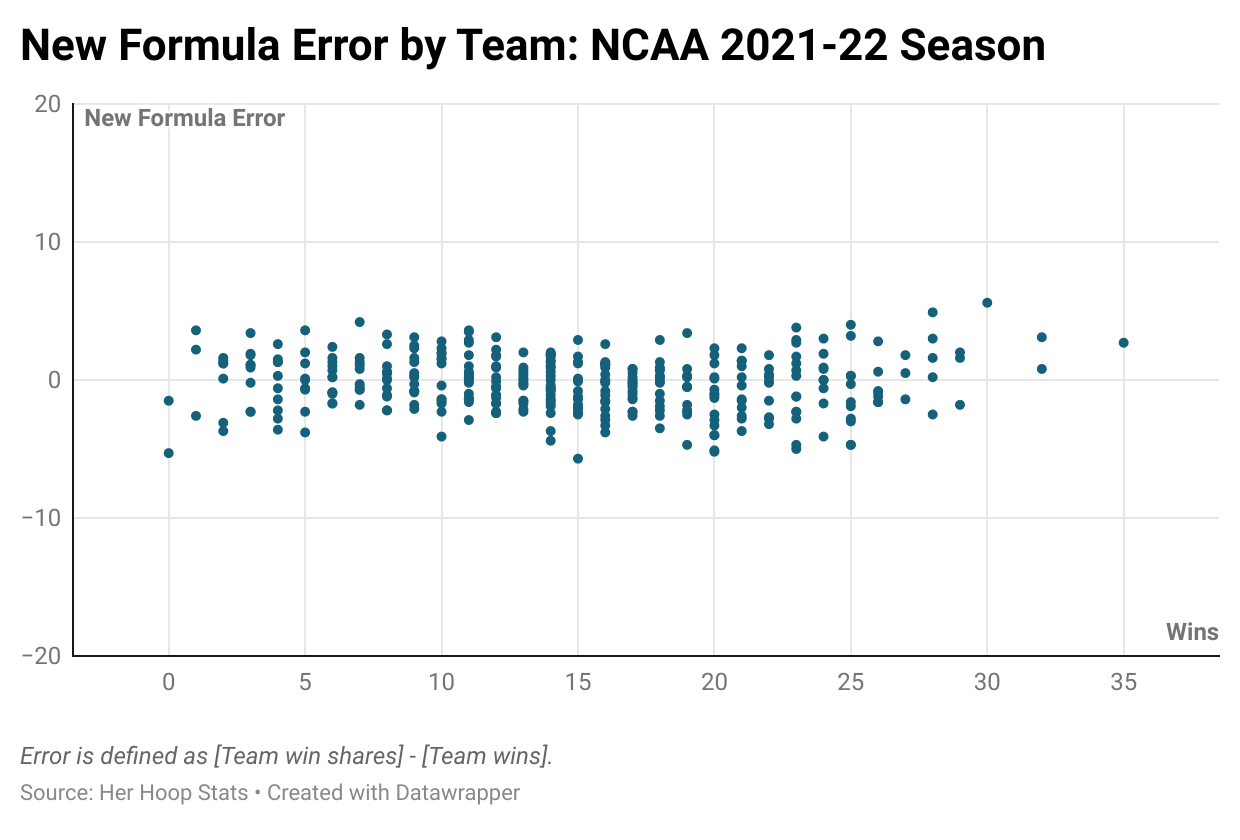
Intuitively, the sum of each player’s win shares on a team should be roughly equal to team wins. How much better at accomplishing this is our new win shares formula? One obvious test is to calculate the difference between the sum of win shares and team wins for each season. We refer to this difference as the error. We calculated the error for each season with the prior and new formulas. Below are the results for last season. It’s clear that the new assumptions greatly reduce the error of our previous win shares implementation. It’s a very similar story for each of the 12 previous completed seasons in our database.
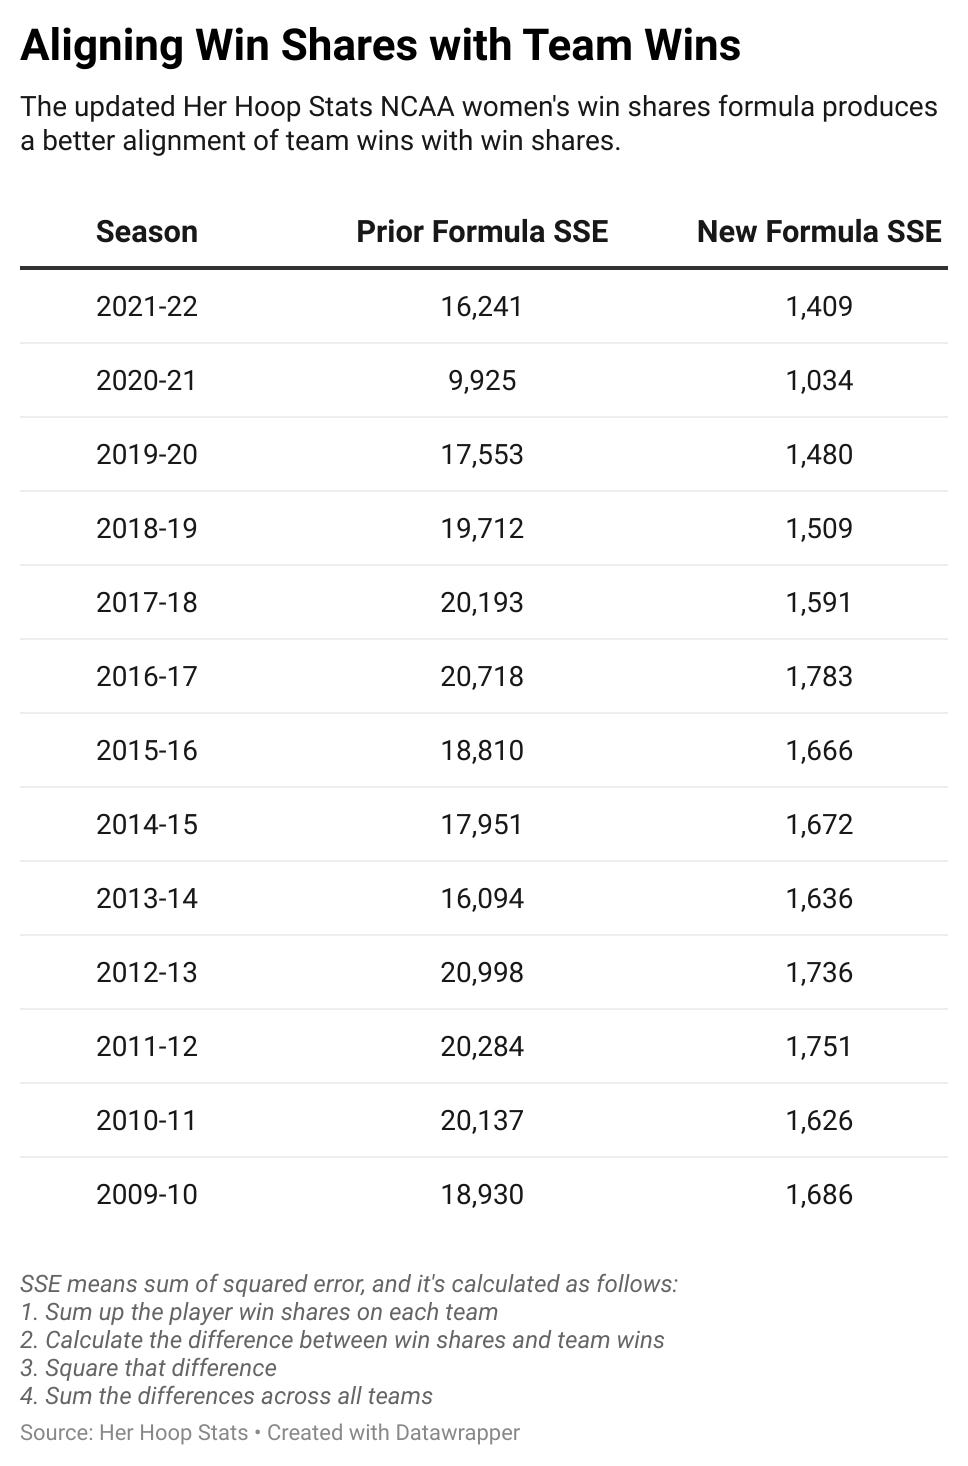
Another metric that measures how well our new win shares formula aligns win shares with team wins is the sum of squared errors (SSE). SSE is a bit different in that it penalizes bigger errors more. It is calculated as follows: 1) compare team wins with a team’s win shares, 2) compute the difference, 3) square that difference, and 4) sum those results across all teams within a season. We calculated SSE for each of the 13 completed seasons in our database using our new formula and the previous formula. The formula that generates a lower SSE does a better job of syncing team wins with win shares.
The SSE for the updated formula is significantly below our previous formula’s SSE in each season we analyzed. The results suggest that the updated formula, custom-built using NCAA women’s basketball data, is a significant improvement strictly in terms of aligning team wins with win shares.
Next Steps
Since the improvements above only apply to the NCAA, we plan to undertake a similar process for WNBA win shares before the start of the 2023 regular season. We will also conduct a review each season to gauge whether there are any assumptions in the win shares formula that require an adjustment. We’re always on the lookout for opportunities to improve, so please contact us on Twitter or via email if you have thoughts on these changes.
Thanks for reading the Her Hoop Stats Newsletter. If you like our work, be sure to check out our stats site, our podcast, and our social media accounts on Twitter, YouTube, Facebook, and Instagram.


