

The NCAA Tournament in Three Graphs
The NCAA Tournament in Three Graphs
Breaking down attendance, parity, and the composition of the Final Four in this year’s tournament

Thanks for reading the Her Hoop Stats Newsletter. If you like our work, be sure to check out our stats site, our podcast, and our social media accounts on Twitter, YouTube, Facebook, and Instagram. You can also buy Her Hoop Stats gear, such as laptop stickers, mugs, and shirts!
Haven’t subscribed to the Her Hoop Stats Newsletter yet?
This year’s NCAA tournament has delivered edge-of-your-seat drama, including the success of double-digit seeds, near-historic upsets by Jackson State and UT Arlington, and instant classics like NC State-UConn’s double-overtime marathon. Oh, and Fran Belibi dunked! I almost forgot that one, which serves as a testament to the multitude of memorable moments March Madness has provided or it’s just a reflection of how bad my memory is (likely a combination of the two). Since the Big Dance wraps up on Sunday, let’s take a look at a few tidbits of information from the tournament’s first 64 games. Maybe it’s the nerd in me, but graphs are fun, so here are three visual representations of those factoids.
Record-breaking attendance

Buoyed by massive audiences at pods hosted by Indiana, South Carolina, UConn, Louisville, and Iowa, this year’s tournament broke the first and second round attendance record set in 2004. An average of 6,778 fans per session took in the action from the tournament’s opening weekend, a 27.9% increase over 2019 (the 2020 tournament was canceled and the 2021 edition had limited attendance, both due to COVID-19). That nearly matches the 28.2% growth in audiences for the entire five-year period from 2014 to 2019.

After attempting a variety of neutral-site formats from 2003 to 2014, decreases in attendance prompted the NCAA to revert to its original campus-sites model. Audiences slowly grew, culminating in this year’s record-breaking attendance figure. The concern with the current format is reducing the likelihood of upsets due to home-court advantage. While a legitimate gripe, multiple underdogs pulled off upsets on the road (Creighton and South Dakota), and others pushed national powerhouses to the brink (Princeton, Jackson State, and UT Arlington).
The answer to the home-court versus neutral site dilemma is unclear. After all, the razor-thin margins in the Princeton-Indiana, Jackson State-LSU, and UT Arlington-Iowa State clashes suggest that a neutral-site structure might have produced even more upsets. However, it’s hard to argue with the attendance figures above and the electric atmospheres generated by the current format.
Was 2022 the year of the underdog? It’s complicated.
Double-digit seeds won nine games in this year’s edition of March Madness, a new record. Several other lower-seeded teams came within inches of adding to that number. So, was this the year of the underdog? Was this the best collective performance in recent memory by underdogs in an NCAA tournament? Yes and no.
To answer this question, I categorized teams as favorites and underdogs using each team’s Her Hoop Stats Rating, which is our predictive metric of team strength based on machine learning. It measures a team’s predicted performance on a neutral court against a hypothetical average team. Simply put, the team in each matchup with the higher Her Hoop Stats Rating was classified as the favorite. Also, while the Her Hoop Stats database extends back to 2010, I only reviewed 2015 and subsequent because of the different tournament structure in 2003-2014 that involved more neutral-site games.
How mad was this year’s edition of March Madness? The number of wins by double-digit seeds in 2022 suggests record-breaking overall performance by underdogs. However, viewing the results through the lens of average margin of victory by favorites paints a murkier picture.
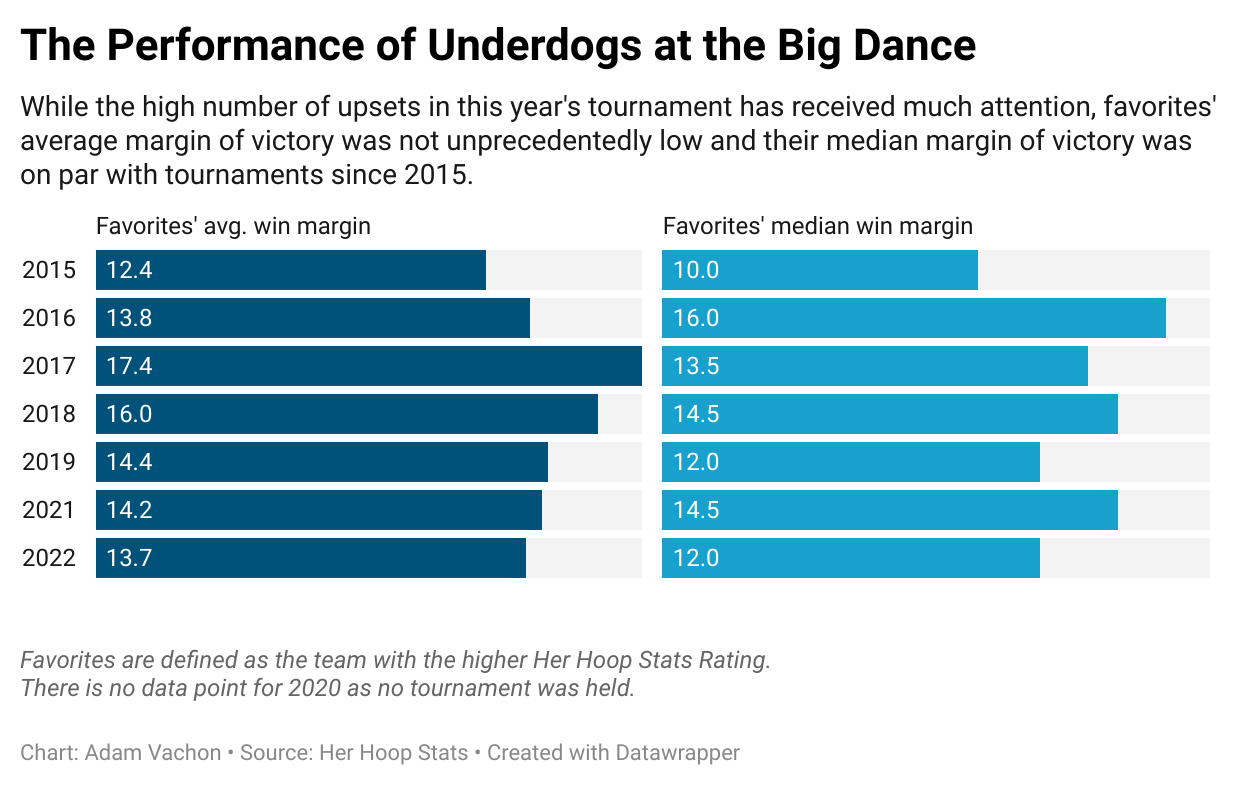
Teams with a higher Her Hoop Stats Rating won their games by an average of 13.7 points, and while that’s the lowest mark since 2017, it’s not unprecedented. It’s on par with the favorites’ margin of victory in the 2016 tournament and actually higher than 2015. Sometimes first-round blowouts can distort the story told by average margin of victory, so I also looked at the median margin of victory. Favorites claimed victory by a median margin of 12 points this year, a tad lower than the typical median margin of victory across the past six tournaments.
A hotly-contested Final Four
In the past, I have waxed poetic about how much joy fans derive from upsets; however, there is something to be said for watching the cream of the NCAA basketball crop battle it out on the national stage for the sport’s top prize. That’s precisely the case this year, as South Carolina, Stanford, UConn, and Louisville, four of the top five teams in Her Hoop Stats Rating, take the court tonight. This weekend’s Final Four is poised to be one of the most hotly contested in tournament history.

How does one predict how hotly-contested a Final Four will be? One measure is the gap between the worst and best teams. In this year’s iteration, the difference between the lowest and highest Her Hoop Stats Rating is the second-smallest since 2010 (8.7 points per 100 possessions on a neutral court). What was the smallest? In 2019, a year where Baylor narrowly defeated Oregon by five points and Notre Dame by one on its way to the national title, the average margin of victory in Final Four games was just 3.3 points.
While it’s a bummer that the NCAA season concludes in only two days, it has taken fans on one heck of a ride. So, strap in! For a tournament that’s offered viewers such compelling action, I for one can’t wait to see what these teams have in store for the grand finale.
Thanks for reading the Her Hoop Stats Newsletter. If you like our work, be sure to check out our stats site, our podcast, and our social media accounts on Twitter, YouTube, Facebook, and Instagram.