Home Sweet Home?
Analyzing how the pandemic has affected home court advantage in college basketball
Thanks for reading the Her Hoop Stats Newsletter. If you like our work, be sure to check out our stats site, our podcast, and our social media accounts on Twitter, Facebook, and Instagram. You can also buy Her Hoop Stats gear, such as laptop stickers, mugs, and shirts!
Haven’t subscribed to the Her Hoop Stats Newsletter yet?
There’s no sound in sports quite like the simultaneous roar of thousands of people whose temporary emotional states all hinge on the same outcome. It’s why coaches and players alike often credit their fans for big home wins. Whether it’s a buzzer beater, a highlight-worthy block, a perfectly executed fast break, or an otherwise mundane play that caps off a 10-0 run and forces an opponent timeout, the audible elation of a home crowd carries with it an unmatched energy.
How much of a tangible impact does that energy have on the game? This year’s attendance restrictions across college basketball have allowed us to measure that impact by looking at its absence. Let’s dive into how this season’s home court numbers stack up to those of the previous five seasons. For this analysis, we will only be using conference games in order to eliminate the effect of mismatched nonconference games.
Winning Percentages
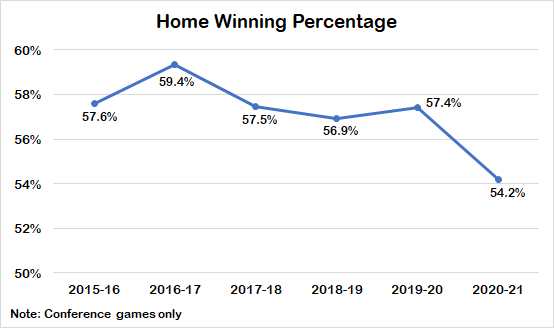
Although far from the end-all, be-all, the simplest place to start is with wins and losses. Over the past five seasons, home teams have won 8,816 of their 15,267 games for a .577 winning percentage. This season’s home winning percentage is down to .542 (1,310-1,108).
Between cancelations causing schedules to be less balanced than usual and the fact that some conferences have played fewer than 100 games this year, the samples for specific leagues are probably too small to draw any conclusions from. But just for fun, let’s take a look anyway. Only nine of 31 conferences playing this season boast an improved home winning percentage. While the MAAC had the lowest home winning percentage over the last five seasons at .553, over half of the conferences are below that mark this year, and six leagues even have home winning percentages below .500.
Net Ratings
Winning is the ultimate goal, but how much a team wins by can tell us a lot more about how it performed. More specifically, we can look at how much a team outscores its opponent by per possession (its net rating).
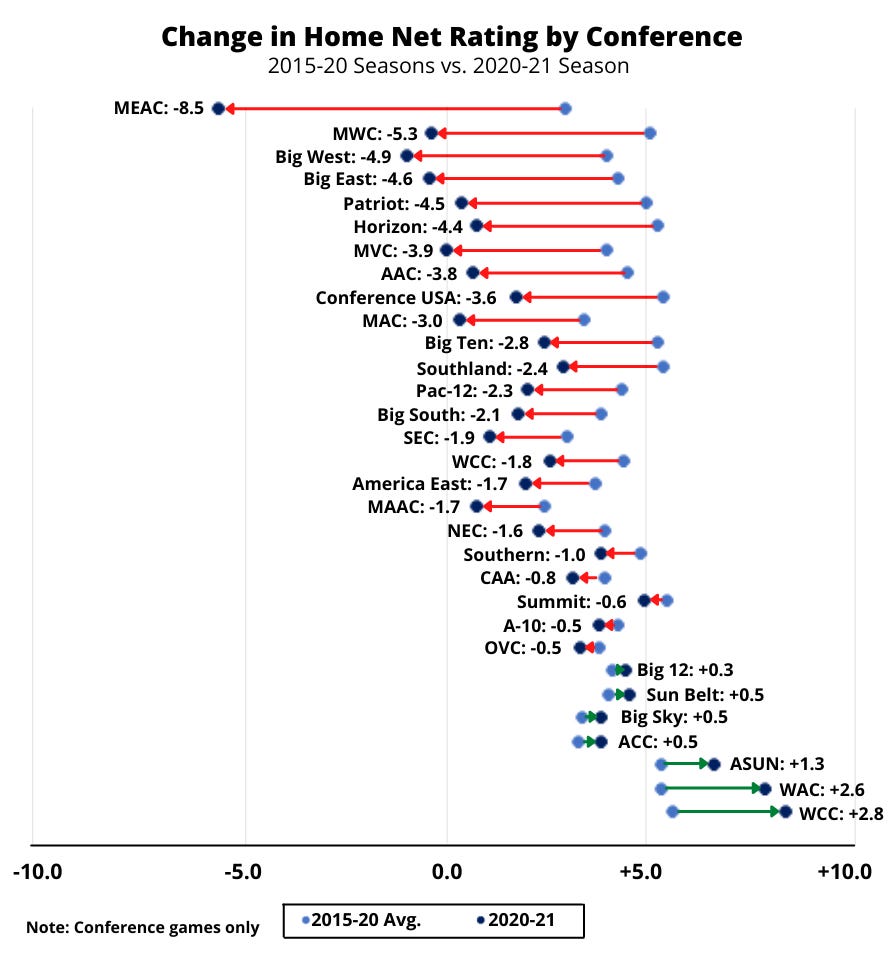
From the 15-16 season through last season, home teams outscored visitors by 4.2 points per 100 possessions. That figure has been nearly cut in half this year, dropping to 2.4. That’s lower than the lowest net rating in any individual conference before the pandemic — the MAAC was previously the kindest league to road teams with a home net rating of 2.5.
Breaking it down by conference, road teams in the MEAC, the Mountain West, the Big West, and the Big East have outscored home teams this year. (MEAC road teams have even outscored home teams by over five points per 100 possessions!) Home and road teams have played close to even in several leagues. Most notably, in the Missouri Valley, hosts have outscored away teams by a mere 14 points: 4,815 to 4,801.
Fouls
Home court advantage helps teams outscore their opponents, but where does it come from? There are a lot of factors (travel fatigue, familiarity with shooting backdrops, altitude acclimation), but one of the biggest — and perhaps the one the fans are most responsible for — is the benefit of the whistle. Referees are human, and even the most unbiased official doesn’t want to draw the wrath of thousands of vocal fans. So have the foul calls been more even this year?
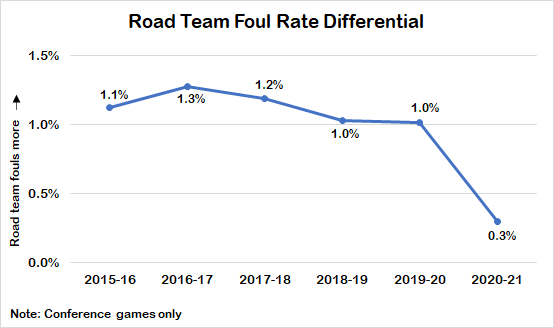
Predictably, the answer to that is yes. In prior years, home teams fouled on 20.3% of plays (where a play is defined as a shot attempt or a turnover), while road teams fouled on 21.4% of plays. Home foul rates have hardly changed this season, currently sitting at 20.1%, but road foul rates have come down a full percentage point (20.4%).
Dead Ball Turnovers
Another stat that’s determined by officials is dead ball turnovers (DBTs). Out-of-bounds calls, travels, carries, charges, moving screens … all DBTs come from a whistle. Some of these calls are obvious of course, but others are 50-50 calls. It’s those borderline calls that more often favor the home team.
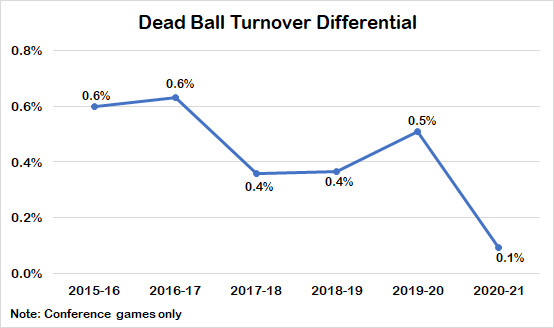
We don’t have the data to break these up by each of those types of calls, but the overall trend for DBTs is consistent with the rest of the numbers. (Note that we are calculating DBTs by simply subtracting steals from total turnovers.) In previous seasons, home teams have committed DBTs on 11.1% of their possessions compared to DBTs on 11.6% of visitor’s possessions. This season’s numbers are nearly identical: 11.35% for home teams and 11.44% for road teams.
A single season can be a small sample, but it seems clear that the numbers confirm what common sense would say. Home court advantage still exists in some form, but its effects are greatly diminished without fans in the seats. The sample of fanless games is one sample size we can hope remains forever a bit too small.
All data used for this piece is from Her Hoop Stats and is updated through all February games.
Thanks for reading the Her Hoop Stats Newsletter. If you like our work, be sure to check out our stats site, our podcast, and our social media accounts on Twitter, Facebook, and Instagram. You can also buy Her Hoop Stats gear, such as laptop stickers, mugs, and shirts!
Haven’t subscribed to the Her Hoop Stats Newsletter yet?


