Whatever Happened to Predictability
Analyzing whether increased parity has fueled the recent barrage of upsets
Thanks for reading the Her Hoop Stats Newsletter. If you like our work, be sure to check out our stats site, our podcast, and our social media accounts on Twitter, YouTube, Facebook, and Instagram. You can also buy Her Hoop Stats gear, such as laptop stickers, mugs, and shirts!
Haven’t subscribed to the Her Hoop Stats Newsletter yet?
When it comes to Division I women’s basketball this season, the word ‘upset’ has become as ubiquitous on social media as posts bragging about Wordle success. From unranked Missouri shocking No. 1 South Carolina last month to South Florida knocking off then-No. 7 Stanford in the Bahamas in November, these unexpected results have dominated the women’s hoops news cycle this year. It has made for a wildly entertaining season. But it does beg the question of why. That is, why have there been so many upsets this season? While it might be random chance, it’s also possible there’s some underlying factor driving this phenomenon. Perhaps many of this year’s upsets are really a function of an increased level of parity. I gathered data from two places to help test this hypothesis: AP top 25 polls and Her Hoop Stats Ratings.
AP Poll Points
The Associated Press weekly poll ranks the country’s top 25 teams based on the votes of 30-40 college basketball observers. The votes each team receives are converted into points - a first-place vote is worth 25 points, a second-place vote nets 24 points, and so on down to a 25th place vote earning the recipient one point. If there were perfect parity, you would expect constant reshuffling of the AP poll’s top 25 and more changes in points as evenly-matched teams continue to defeat one another.
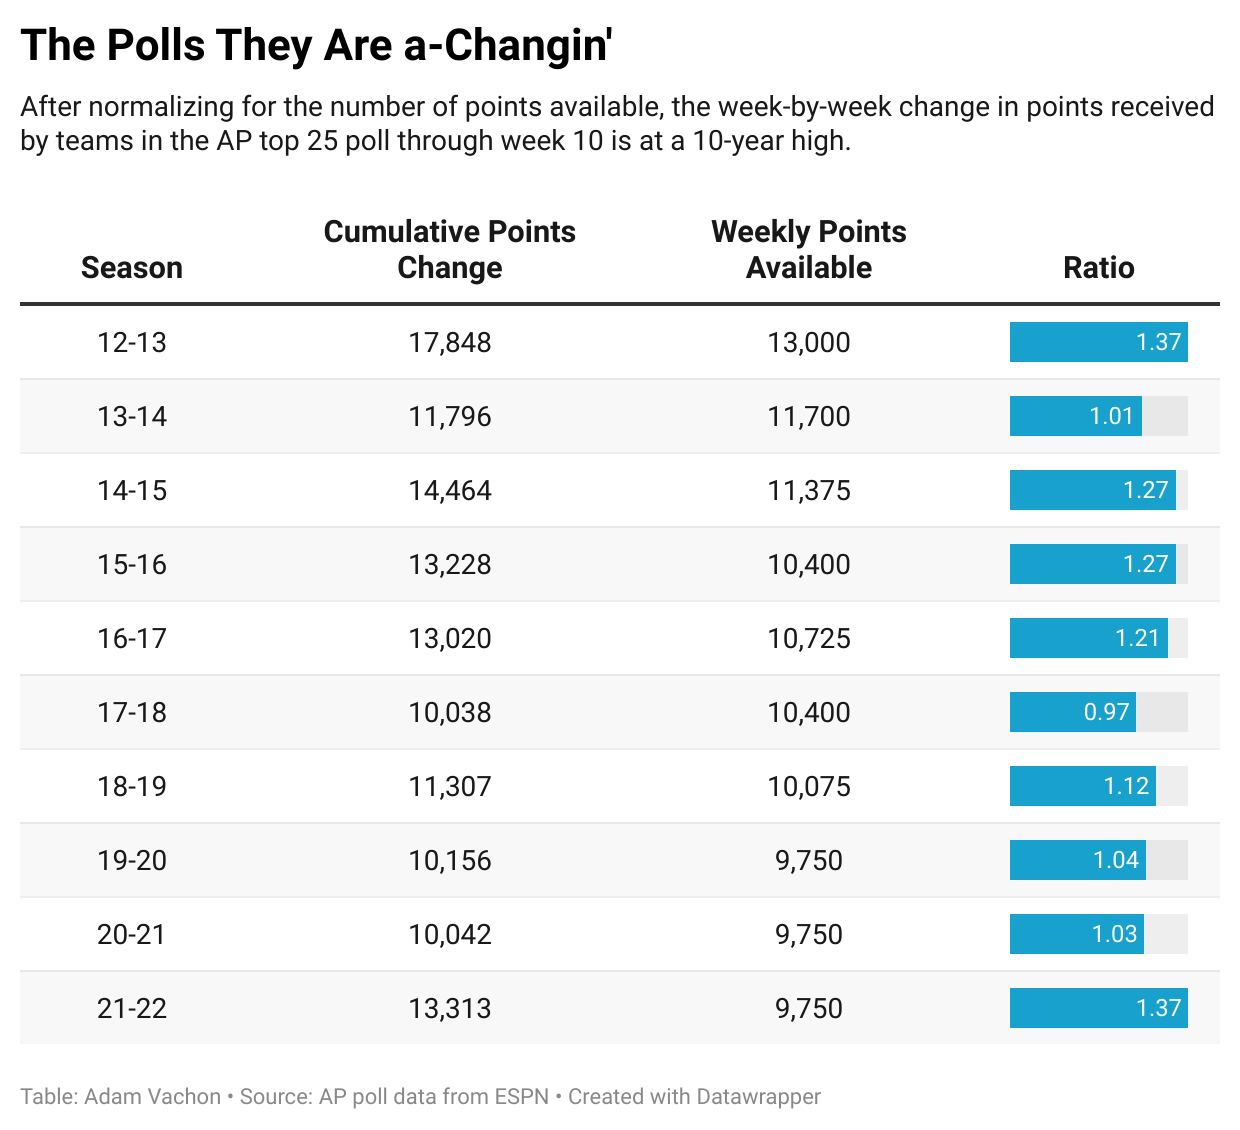
Using AP poll data from ESPN over the past 10 seasons, I analyzed the weekly change in points received for each team that earned a top-25 vote. Summing these changes across all teams and weeks yielded the values in the second column of the table below. Since we only have 10 weeks’ worth of poll data this season, the cumulative points changes for prior seasons include only the first 10 weeks of AP polls. The number of voters in the AP poll, and by extension, the number of points available each week, varies from season to season. All else equal, a season with more poll points should have higher point fluctuations. I accounted for this difference by taking the ratio of cumulative points changes to the weekly points available. This generated the parity measure displayed in the final column of the table.
This season’s total cumulative points change is the highest since the 2014-15 season. After adjusting for the higher number of weekly points available, the 2021-22 season has seen the greatest change in weekly AP poll points since the 2012-13 season. So, by this metric, parity is at a 10-year high.
There are a few shortcomings with this approach. First, it only measures parity among teams who have received votes in the AP poll (49 teams so far this season). A different measure is required to ascertain the level of parity among a broader swath of teams. Second, the combination of the transfer protocol, game postponements due to COVID-19, and player absences due to COVID-19 have made it uniquely difficult for voters to determine teams’ true identities. So, the relatively large change in AP poll points may simply be reflecting voters’ uncertainty.
Overall, the AP poll data points to the likelihood of increased parity this season. However, given the aforementioned shortcomings associated with this measure, let’s supplement this with another metric.
Her Hoop Stats Rating
The Her Hoop Stats Rating is our predictive metric of team strength based on machine learning. It measures a team’s predicted performance on a neutral court against a hypothetical average team. For example, South Carolina currently boasts an HHS Rating of +45.8. This suggests that South Carolina would be expected to outscore a hypothetical average opponent by 45.8 points per 100 possessions on a neutral court (a typical game has about 70 possessions for each team). The HHS Rank is the ranking of each team by HHS Rating.
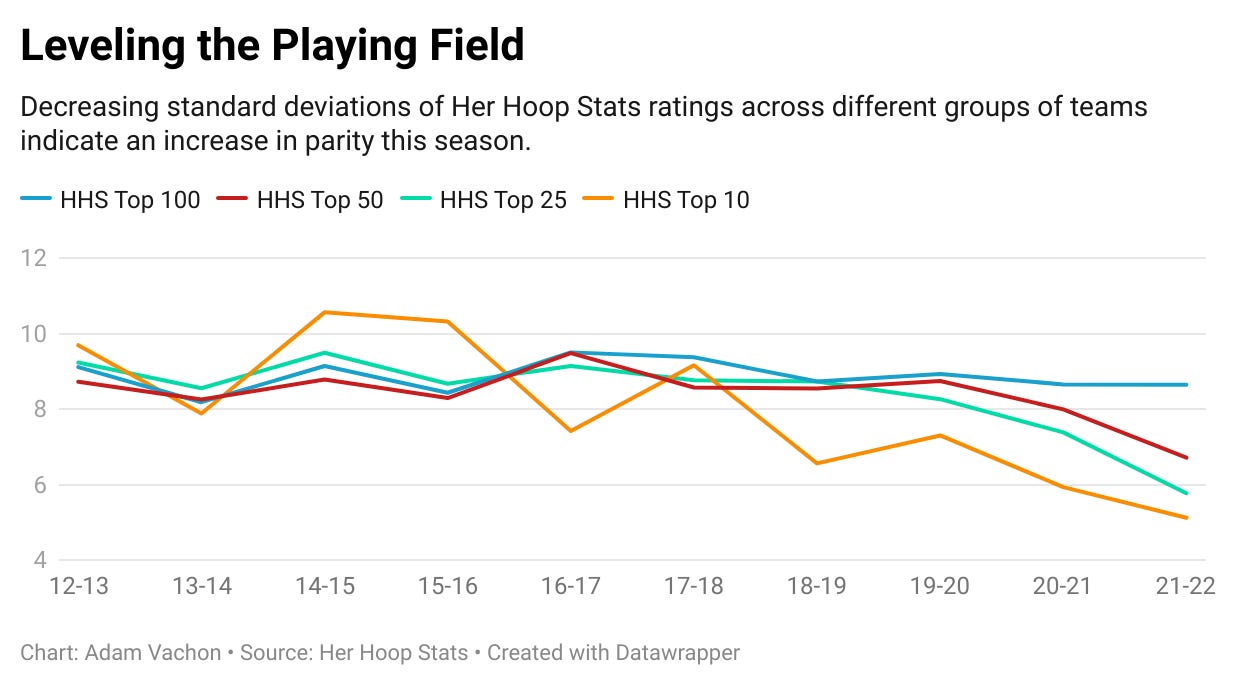
So, how does this help us on our quest to measure parity? We can review the spread of HHS Ratings by season to evaluate the evenness of the playing field. In particular, I calculated the standard deviation, a statistical measure of variation, of the HHS Ratings for teams with an HHS Rank in the top 100, top 50, top 25, and top 10. The graph below presents this information for the past 10 seasons, with a low standard deviation figure indicating less distance between the top and lower-ranked teams, and hence a higher degree of parity.
Like the AP poll results, this metric indicates that parity is at a 10-year high. This conclusion applies to the HHS top 50, top 25, and top 10. Unfortunately for teams No. 51-100, such balance hasn’t yet spread to the HHS top 100.
Expect the Unexpected
With all due respect to the Her Hoop Stats prediction model, unpredictability makes sports interesting for fans, and a high level of parity fuels the potential for upsets. The AP polls and HHS ratings each indicate that parity in Division I women’s basketball is at its highest level in 10 years. To be sure, this finding applies to a relatively narrow selection of the country’s teams (i.e., the top 50, which represents only 14% of all Division I teams). So, don’t expect this to translate into earth-shattering upsets in the NCAA tournament on the order of a No. 15 seed ousting a No. 2 seed. However, Missouri, South Florida, Nebraska, Kansas State, and countless others have taught us that almost anything is possible within the upper echelon of teams this season. One thing’s for certain: fans should buckle up for a wild, upset-filled, and thrilling ride the rest of the way!
Thanks for reading the Her Hoop Stats Newsletter. If you like our work, be sure to check out our stats site, our podcast, and our social media accounts on Twitter, YouTube, Facebook, and Instagram.


