Updated WNBA Win Shares Calculation
Breaking down the changes to our WNBA win shares calculation and how we have customized the formula's assumptions to the WNBA
Thanks for reading the Her Hoop Stats Newsletter. If you like our work, be sure to check out our stats site, our podcast, and our social media accounts on Twitter, YouTube, Facebook, and Instagram. You can also buy Her Hoop Stats gear, such as laptop stickers, mugs, and shirts!
Haven’t subscribed to the Her Hoop Stats Newsletter yet?
How does one evaluate a player’s value in a team sport? As the heated WNBA Most Valuable Player debate might suggest, it’s complicated. Today, we’re going to look at a statistic you may have heard referenced in these contentious discussions: win shares. In particular, we’ll discuss how we’ve updated our formula that calculates win shares in the WNBA.
Before diving into the gory details, let’s start with the basics. A win share is a statistic that estimates the total number of wins a player produces for their team through their play on the offensive and defensive ends of the court. In other words, win shares divide up credit for a team’s wins. If you add up the win shares for each player on a team, theoretically, the sum should be equal (or at least reasonably close) to a team’s win total. As we’ll demonstrate below, our updated win shares formula more closely aligns team wins and win shares and applies to all seasons in our database
Last spring, we performed a similar exercise for the NCAA, changing two of the formula’s assumptions in order to bring a team’s win shares and its total wins closer together. We’re excited to have now expanded that work to the WNBA. None of this would have been possible without folks like Dean Oliver, who derived key components of the win shares formula in his groundbreaking book, “Basketball on Paper,” and those at Sports Reference, who very clearly outline the basic steps for calculating win shares on their website. The changes described below are an extension of their excellent work.
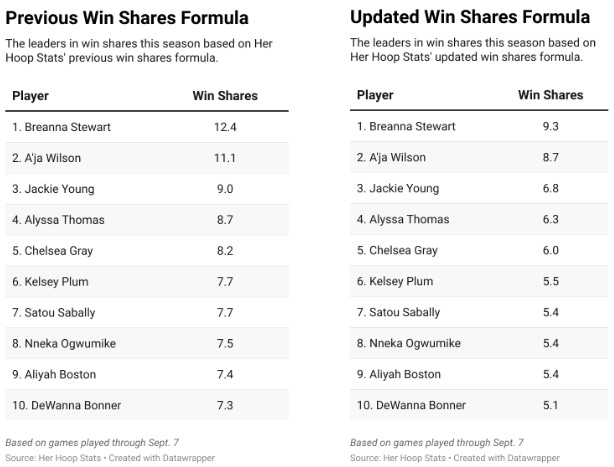
What is the impact on players’ win shares?
The technical details of the changes appear below, but many readers are likely most interested in what impact these changes have on the win shares for specific players, particularly those in this season’s MVP discussion. First, similar to the NCAA, the updated WNBA formula generally reduced the number of win shares for each player. This is because our previous implementation of the win shares formula effectively produced too many win shares when compared to team wins. When it comes to player win shares rankings, the order was mostly preserved. Take this season for example. Comparing our previous formula’s output of win shares for the league’s top 10 (on the left) to that for the current formula (on the right), the values are scaled down, but the top 10 was unchanged.
What we changed
Since the formula for win shares is complicated, we’ll focus on the parts of the formula that we tailored to the WNBA. We encourage you to check out Sports Reference for further details on the standard win shares formula.
Marginal points per win
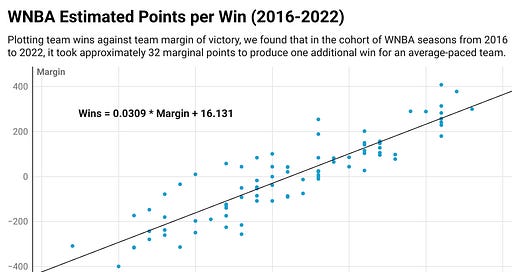
A key part of the win shares formula involves assumptions around how many extra points a team needs in a season for an additional win, a figure known as marginal points per win. To estimate this for the WNBA, we plotted team wins against margin of victory (team points scored less team points allowed over a full season) across selected groups of seasons and calculated the line of best fit. We reviewed groups of seasons instead of individual seasons because a single season’s worth of data (i.e., 12 data points in recent seasons) was too noisy for the purpose of this exercise. We separated the data into two cohorts of seasons: 2016-2022 and 1997-2015. This split was based on factors such as the uptick in points per game in 2016 and, relatedly, the WNBA shifting to a 14-second shot-clock reset on offensive rebounds that season.
Below is the scatterplot we produced for the cohort of seasons from 2016 to 2022. The line of best fit indicates that approximately 32 marginal points were needed to produce one additional win over that timeframe (i.e., 1.0 divided by the slope of the line of best fit, 0.0309).
We repeated this exercise for the time period 1997 to 2015 and found that the marginal points per win over that timeframe is approximately 30. Therefore, we selected a marginal points per win value of 32 for seasons 2016 and subsequent and a marginal points per win value of 30 for older seasons. Our selected marginal points per win values are analogous to the part of the traditional marginal points per win formula that multiplies a constant by the average points per game for a WNBA team. It’s also important to note that we have retained the portion of the traditional marginal points per win formula that adjusts for a team’s pace. That is, a team that plays at a faster pace requires more marginal points to create one additional win. Therefore, the 32 and 30 marginal points per win in our updated formula reflect the number of additional points an average-paced team needs to produce an additional win.
Marginal offense and defense
The other key components we adjusted were marginal offense and marginal defense. Generally speaking, these estimate the value a given player adds over and above a replacement player. Marginal offense is calculated as the estimated number of points a player produces less the estimated points produced by a hypothetical replacement player, which in the standard formula for college is thought to be 8.0% less productive than the league’s average player (or, in other words, a coefficient of 0.92 x [league points per possession] x [offensive possessions]). A similar logic applies to marginal defense.
We tested several replacement player coefficients (along with different marginal points per win values) – marginal offense and defense replacement player coefficient pairs of 0.905/1.095, 0.910/1.090, 0.915/1.085, 0.92/1.08, and 0.94/1.06 – and found that a marginal offense replacement player coefficient of 0.91 and a corresponding marginal defense replacement player coefficient of 1.09 yielded the smallest difference between team wins and win shares.
Win shares versus team wins
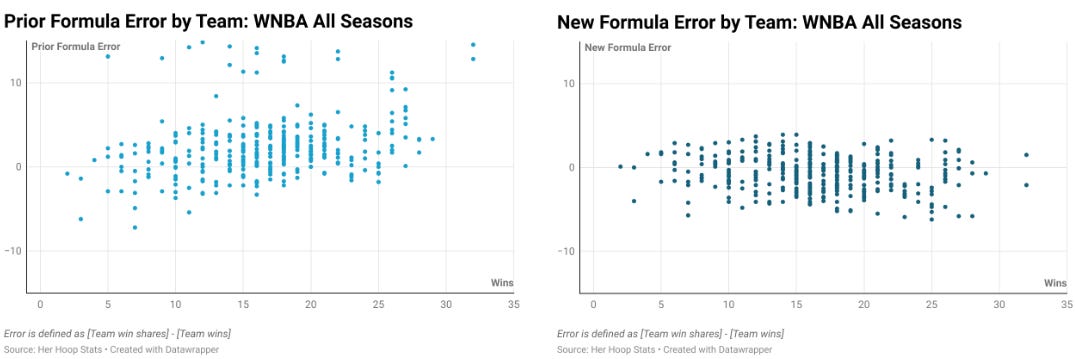
Intuitively, the sum of each player’s win shares on a team should be roughly equal to team wins. How much better at accomplishing this is our new win shares formula? An obvious test is to calculate the difference between the sum of win shares and team wins. We refer to this difference as the error. We calculated the error for each season with the prior and new formulas. Below are the results across all WNBA seasons.
It’s clear that the updated formula, custom-built using WNBA data, is a significant improvement strictly in terms of aligning team wins with win shares. Under our old formula, the average error per team (over all 27 WNBA seasons) was approximately 3.07. In other words, a team’s win shares differed from its win total by an average of 3.07. That figure is now 1.78 using our new win shares formula. Not only are the errors themselves smaller, but they are more random. The previous formula produced errors that increased linearly with team wins, though this relationship was rather weak.
What’s Next?
We plan to conduct a review each season to gauge whether there are any assumptions in the win shares formula that require an adjustment. We’re always on the lookout for opportunities to improve, so please contact us on Twitter or via email if you have any thoughts on these changes.
Otherwise, enjoy using this improved win shares statistic in your MVP arguments, especially those of you finalizing your MVP ballots today. Of course, no single stat tells the whole story of player performance, our hope is that by improving our win shares calculation, we’re helping people discuss the game more accurately.
Thanks for reading the Her Hoop Stats Newsletter. If you like our work, be sure to check out our stats site, our podcast, and our social media accounts on Twitter, YouTube, Facebook, and Instagram.


This is great stuff. The game needs it.
Great info. I'm glad there is enough data available to make these calculations.